

Overview
UCLA’s Enterprise Data Analytics Reporting & Analytics team created three dashboards to track and provide support to impacted employees and students from the January 2025 wildfires in Los Angeles. The team asked, “Can we see who is impacted by the wildfires that took place in January?” and then came up with a solution, leading to winning the Silver Operational Excellence Award at the 2025 UC Tech Awards.
The Challenge
Before implementing our current dashboard system, the university’s disaster response was dependent on self-reporting by employees and staff. This approach often resulted in delays and incomplete information, hindering timely and effective support for those who were impacted. The absence of real-time data made it challenging to assess the full scope of impact, leading to a reactive rather than proactive outreach.
The Approach
Recognizing these limitations, we developed and deployed comprehensive dashboards to enhance our operational response. These tools allow us to swiftly identify impacted individuals and provide them with necessary resources, facilitating a more proactive and efficient disaster response strategy.
Data Source Gathering & Merging
Team Members: Celia Cheung, Bo Suzow, Michael Newbill, Hilda Duggan, Max Turteltaub
In a display of incredible teamwork, Celia & Bo gathered addresses of the UCLA community and converted the addresses into latitude & longitude geocoordinates, respectively. Celia utilized expert knowledge of the data from UCPath, the University of California’s payroll, benefits, human resources and academic personnel system, to intake UCLA & ASUCLA (Associated Students of UCLA) employees, and Student Information Systems (SIS) shared undergraduate and graduate student data. Bo built a script in Python to convert the address files into a format for Tableau’s use.
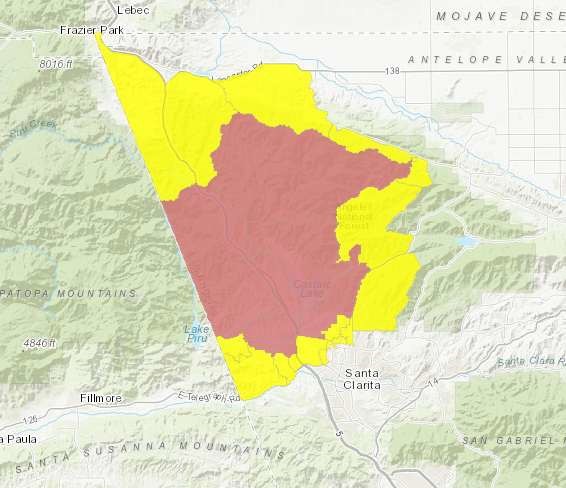
The next key piece to making this dashboard functional was being able to have access to current evacuation zones. Much of the data informing the public came from the Watch Duty app and Genasys. Our constraint was there is no ability to API call or integrate into Tableau. Working with UCLA’s ArcGIS access, Max researched hundreds of maps and layers that are compatible with Tableau. He landed on CA_EVACUATIONS – Overview, owned and run by the California Office of Emergency Services. This map, refreshed every 20 minutes, mirrors the schemas that populate the Genasys and Watch Duty evacuation zones. To ensure speed and accuracy of the Tableau report, the team manually downloaded the map’s shapefiles that served as the base of the dashboard’s map.
Mapping Individuals
Team Members: Dylan Henson
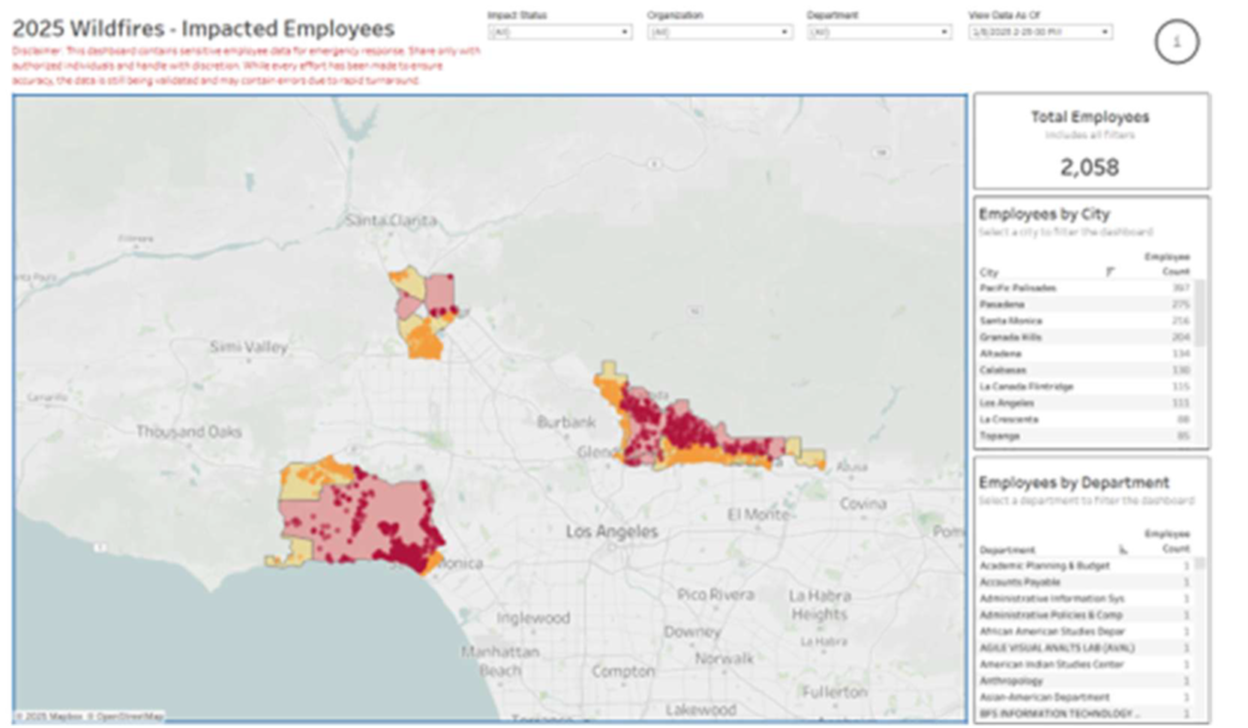
Dylan intertwined the ArcGIS shapefiles and the geocoded employees to develop a dashboard that displays employees in evacuation zones. In addition to the map, the dashboard’s dynamic ability to filter on department (employee dashboard only) or student class (student dashboard only), evacuation warnings or order, or timing of evacuation notices allowed university leaders to view the necessary information. He included individuals’ contact information and their emergency contacts in a downloadable table to aid in the speed of outreach. With help from Copilot, he was able to create a python script that captured historical shapefile information to create deltas showing the fluctuation in the number of people in evacuation zones over time. This allowed us to filter the report on evacuation zone timing and to see and track the progression of the wildfire activity.
User Specific Access
Team Members: Dylan Henson, Gina Sheridan, Sachin Goli
Due to the private and sensitive nature of the situation and data, university leadership needed to ensure department leaders only saw their impacted employees, which was made possible by implementing Row Level Security functionality to control user access to the data. Dylan made an additional report to support that initiative. The Business Systems Analysts and Sachin created a process to intake, update, and notify department leads’ requests. The team maintained a row level security sheet that Dylan utilized to ensure data security and added department leads to a specialized Tableau access group.
Row-level security sheet
Speed & Accuracy
Team Members: Everyone
In the span of two business days, the team gathered sources, integrated them together, and produced a dashboard that allowed leadership to begin outreach and support to impacted employees and students. After launching the first dashboard on all impacted employees for university leadership, the team continued to iterate and improve. The team quickly put together the student dashboard and followed with the row level security dashboard. The current iterations of the reports were completed in a week, are updated as zones appear and disappear, and will continue to be improved in times of non-emergency. From start to finish, this dashboard was stable before January ended. The fires began on January 7, 2025. The first dashboard was available by January 9 and was in maintenance and refreshes by January 15.
Alignment with the University of California Mission
The work this team did furthers both UC & UCLA’s missions to provide public service through teamwork and the confluence and dissemination of knowledge. Each team member brought their unique skillsets, research abilities, and selflessness to pull pieces of data from internal and external sources to deploy a dashboard that directly supports the UCLA community in the immediacy and future.
Due to this emergency, we were forced to innovate new processes and features in our reporting. Thanks to great collaboration with the California Office of Emergency Services, our first great innovation was the ability to work with ArcGIS shapefiles to display a map of evacuation zones. The OES office graciously worked with our team to help answer questions and remediate any discrepancies we’d discover. Our teams worked hand in hand to make sure all data was as up to date as possible. Our second innovation was the ability to display historical map files. With support from Copilot, we were able to have the dashboard load and populate historical evacuation zones. This helped university leadership track deltas and prioritize individuals. The final innovation was larger scale row level security. In combination with our Tableau group provisioning tool and a row level security entrance sheet, we improved the speed and functionality of our RLS capabilities.
The Impact
By the Numbers
- Highest Total of Known Impacted by Fires: 3,336 individuals
- Addresses Geocoded: 93,012
- ArcGIS Shapefiles Used: 12
- Updates published: 121 (Student – 33, Staff RLS – 46, Staff – 42)
- Fires monitored: 5 (Palisades, Eaton, Sunset, Hughes, Lilac)
Why It Matters
Depth of Impact
The creation of these dashboards allowed university and department leadership to offer physical, emotional, and monetary support to the 3,300+ impacted employees, students, and their families. Because of our speed and ability to keep up-to-date data, we were able to help our community in almost real-time.
Longevity
The innovation of creating this dashboard will allow us and UCLA’s Emergency Support team to support the community for future emergencies. The pioneered relationship with the state’s Office of Emergency Services will allow UCLA to continue to be up to date with active emergencies. Whether it be more wildfires, earthquakes, or floods, UCLA will be able to best help its people persevere and rebuild through tragedy. University leadership now has a readily available tool to accelerate decision making and connect with impacted community members.
Meet the Award-Winning Team
Team Name: Enterprise Data & Analytics – Reporting & Analytics Team
Award Category: Operational Excellence
Location: UCLA
2025 Silver UC Operational Excellence Award Winners:
- Celia Cheung – Sr. Reporting & Visualization Developer
- Bo Suzow – Business Systems Analyst
- Max Turteltaub – Sr. Business Systems Analyst
- Dylan Henson – Sr. Reporting & Visualization Developer
- Gina Sheridan – Business Systems Analyst
- Sachin Goli – Tableau Administrator, Reporting and Analytics
- Michael Newbill – Manager, Enterprise Reporting & Analytics
- Chris Lechner – Director, Reporting & Analytics
- Hilda Duggan – Executive Director, Enterprise Data and Analytics
Read More
Read the team’s complete UC Tech Awards application
Learn more about the UC Tech Awards Program
Contact

Sr. Business Systems Analyst, Enterprise Data & Analytics
UCLA
[Cover image and event photo of Chris Lechner courtesy of Andrew Castro]